The prize, in plain words
On 12 October 2026, the Royal Swedish Academy of Sciences awarded Robert E. Hall and Michael Woodford the Prize in Economic Sciences. Hall works at Stanford University, while Woodford works at Columbia University. The official reason reads "for microeconomic foundations of macroeconomic stabilisation". Here, "micro" refers to single households and firms, while "macro" refers to the economy as a whole.
The prize is for models of the whole economy built from household and business choices, rather than statistical patterns between national totals. A model is a simplified description of the economy, written in equations, that economists use to test "what if" questions. A central bank sets interest rates, the price of borrowing money, to keep prices and jobs steady. Higher rates make borrowing costlier, so people and firms spend less, which slows price rises. Central banks, including the US Federal Reserve and the European Central Bank, use models built from these choices.
That approach was learned the hard way. In the 1960s, economists relied on a simple pattern known as the Phillips curve. When few people were out of work, employers raised pay to attract staff, and firms passed those costs into higher prices. So low unemployment came with higher inflation, the general rise in prices. In the 1970s the pattern broke: inflation and unemployment rose together. Part of the reason was that people had come to expect higher inflation and built it into wages and prices. Patterns between national totals reflect behaviour under the policy of the day, so changing policy changes behaviour and breaks those patterns. Choices rooted in people's goals and budgets hold up better.
What Hall's work shows about households
Hall showed how to test household plans, given that people try to keep their spending smooth from year to year. His 1978 test assumed that people plan around what they expect to earn over their whole life, rather than just the income arriving this month. Under that assumption, future spending changes should be hard to predict. Although expectations cannot be seen, the test could use data.
In 1982, Hall and Frederic Mishkin tested this idea using data on what real families spent on food. About 80% of that spending looked planned ahead, while about 20% simply followed income as it came in.
Economists now count "hand-to-mouth" households, which have little money readily available for everyday bills. The old phrase means living from one pay cheque to the next. These families tend to spend each pay cheque as it arrives. A 2014 study of US surveys from 1989 to 2010 found that about 31 in every 100 households lived this way. Many owned a home or retirement fund but had little cash at hand (Kaplan, Violante and Weidner, 2014). Economists at the Federal Reserve Bank of St. Louis later updated the count with the same method. By 2022, the figure had fallen to about 19 in every 100 (Kozlowski and Jordan-Wood, 2024).
Newer models let households differ in this way, so a change in interest rates or prices reaches each group differently.
What Woodford's work shows about firms
Woodford brought firms and the central bank together in one working model, set out in his 2003 book, Interest and Prices. This New Keynesian model, named after John Maynard Keynes, builds the economy from households and firms whose prices adjust slowly. It is the core of the models central banks use today.
The Academy's summary makes the connection clear: inflation comes from the price decisions of thousands of businesses. Interest rates change how much people spend, which in the end affects the prices that firms charge for their products. Because firms in the model get only occasional chances to change prices, they weigh future costs and rivals' prices for the months ahead.
Firms and households look ahead, so trust in what a central bank says about the future moves prices today. This idea lies behind inflation targets and the hints that central banks now give about their next steps. An inflation target is the rate of price growth a central bank aims for. The model treats a jump in costs differently from a drop in demand, because each needs a different response. The committee says this thinking helped central banks handle the pandemic and recent energy shock better than the crises of the 1970s. The committee adds that this is hard to prove.
What the committee says the model still lacks
The committee's scientific background names two gaps.
The first gap is timing: when firms decide to change a price. The standard model treats repricing like a lottery: every month, each firm has the same fixed chance of changing its price, whatever its costs. This keeps the model simple enough to solve and fit to data. The committee calls it an extreme way to model the cost of changing a price. The committee notes that real firms should reprice more often when costs jump. Models built that way exist, but economists have not agreed on one to replace the standard.
The second gap is data: how prices move in different places and industries. After 2021, economists studied the "heterogeneity in price movements across space and sectors". This means how prices moved differently from place to place and from one industry to another. It helped explain what caused the price jump and why it lasted. That work rests on two numbers, how often prices change and by how much, usually taken from official price records. These records cover a limited number of shops and outlets, and comparisons are harder because each country keeps its own. Most research using them has been built on goods, while service prices, including restaurant meals, are hard to compare in the same way.
What restaurant menus and store shelves show
Realytics tracks more than 500 million priced items across online menus and store shelves. On menus, that is more than 180 million items from more than 2 million menus. The coverage is growing. This article reports on 15 large markets.
This data speaks to both gaps. For the first gap, timing, Realytics follows price changes item by item, every month. It measures how often prices change, how large the changes are, and how many change at once (Findings 1 to 3). For the second gap, places and industries, it compares restaurant menus with store shelves, using one method across all 15 markets (Findings 4 and 5). Finding 6 follows customers' opinions about prices after rises of different sizes.
We measured both numbers for restaurants using the same approach as price researchers (Nakamura and Steinsson, 2008). For every month from September 2025 to September 2026, we compared each menu item's price with its price a month earlier.
Each finding below starts with what Realytics' data shows. Where earlier research studied the same question, a second part, marked "What earlier research found", compares its findings with our numbers.
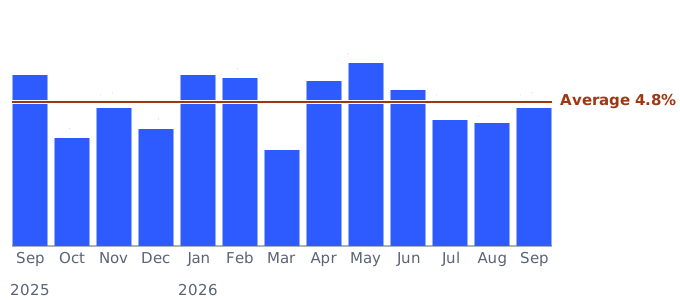
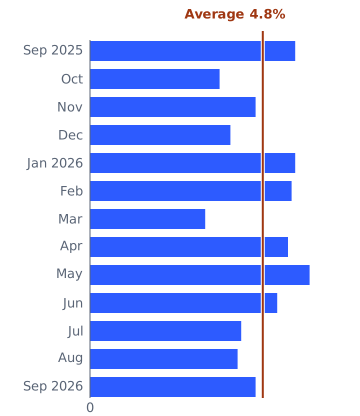
Finding 1. Each month, 4.8% of menu items change price across all 15 markets.
Across all 15 markets, the monthly share ranged from 3.2% in March 2026 to 6.1% in May 2026. This shows how the pace of change varied. How often prices change helps explain how quickly higher costs can reach customers.
Share of menu items changing price each month, all 15 markets, Sep 2025–Sep 2026.
Source: Realytics · realytics.com · monthly share of menu items changing price, Sep 2025–Sep 2026
What earlier research found. When costs jump, firms reprice more often: the link the committee says the standard model misses. In the typical US product group, about 10 in 100 prices changed monthly before the pandemic, excluding sales. That share exceeded 20 in early 2022 and eased to about 13 in January–August 2024 (Montag and Villar, 2025). Repricing also sped up after the energy shock, adding evidence of how firms respond to changing costs (Cavallo, Lippi and Miyahara, 2024).
Europe gives more detail, from central-bank economists studying official price records in the euro area, whose members use the euro. They left out energy prices and temporary sales. From 2010 to 2019, about 8 in every 100 prices changed each month, compared with about 12 in every 100 in 2022. Before 2020, about two in three price changes were increases. In 2022, more than four in five were. By 2024, food prices changed less often again, while service prices, including haircuts and repairs, still changed more often than usual. In the team's model, faster repricing raised peak inflation by almost one point (Gautier and co-authors, 2026). Percentage points measure gaps between rates: a rise from 2% to 3%, for example, is one point.
Firm surveys now test the lottery idea directly. A January 2026 Bank of England working paper, an early research report, gives UK survey findings from 2023–25 (Bunn and co-authors, 2026). Among hotel, restaurant and café firms, 72% said they mostly reprice when events call for it, rather than on a fixed schedule.
Recent restaurant studies show how higher wages reach prices. The minimum wage is the lowest hourly pay allowed by law. In April 2024, California raised the minimum wage to $20 an hour for workers at large fast-food chains. Six months later, online menu prices at California fast-food restaurants were about 2% higher than in comparison states. The study estimates that about 60% of the extra wage cost reached customers (Sosinskiy and Reich, 2025).
At McDonald's in 2016–20, a 10% minimum-wage rise raised Big Mac prices by about 1.4% (Ashenfelter and Jurajda, 2022). Earlier, in 1995–97, a 10% minimum-wage rise raised US restaurant prices by about 0.7% (Aaronson, French and MacDonald, 2008).
Our monthly record measures how often prices change, for each place and each month. Our 13 months cover one period: they show the level of repricing and how it swings from month to month.
Finding 2. Most changes are increases, and they are sizeable.
Across all 15 markets, increases make up 82.4% of price changes. The median change, the middle value when changes are lined up by size, is 6.2%, counting cuts and rises alike. The median increase is 5.9%, while restaurants tend to cut a price by more than they raise one.
Finding 3. Some menus change many prices at once.
Across all 15 markets, 17.6% of menus change at least one price in a given month. In the median menu that reprices, 11.0% of items change. In 21.5% of these repricings, at least half of the menu's items change price during the same month.
What earlier research found. Economists have a name for one reason to change many prices at once: they call the costs of changing prices "menu costs", after printed menus. These cover printing new menus, updating price lists and the risk that regular customers notice. Restaurant prices jumped when countries switched to euro cash in 2002, and a study explained the jump through menu costs. Restaurants grouped their price rises around the moment they already had to reprint their menus (Hobijn, Ravenna and Tambalotti, 2006). Croatia adopted the euro in January 2023. The EU statistics office, Eurostat, estimated that the switch added 0.04 to 0.18 percentage points to that month's overall inflation. Restaurants and cafés headed its list of services with unusual price rises (Eurostat, 2023). The batch updates in our data fit the menu-cost idea: if every change carries a cost, it makes sense to make several at once.
Finding 4. Restaurant price changes differ by country.
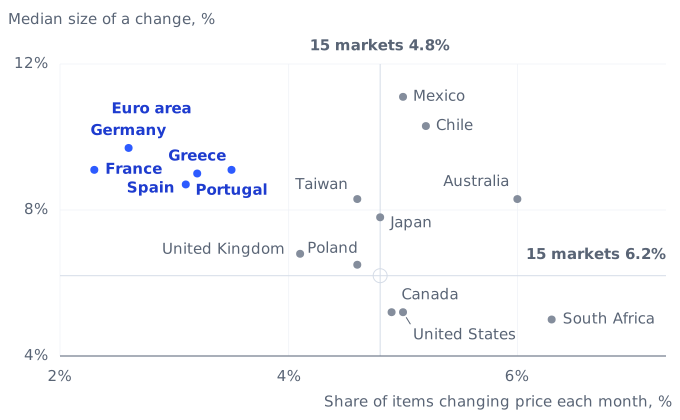
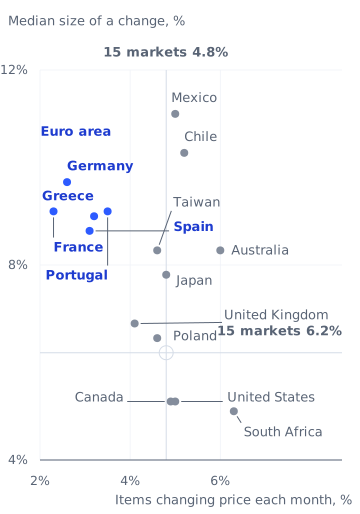
Figure 2 compares the 15 large markets in this article. In France, 2.3% of items change price monthly, with a median change of 9.1%. In the US, 5.0% change each month, with a median change of 5.2%, showing more frequent but smaller changes. Germany, Spain, Portugal and Greece look like France, with fewer, larger changes. Canada and South Africa look like the US, with more frequent, smaller changes.
Frequency and median size of menu price changes, 15 large markets. Blue marks show the euro area, Sep 2025–Sep 2026.
Source: Realytics · realytics.com · frequency and median size of menu price changes, Sep 2025–Sep 2026
What earlier research found. Official price records point the same way. In France, about 4 in every 100 restaurant prices changed each month from 1994 to 2003. Across all prices, about one in five changed monthly (Fougère, Gautier and Le Bihan, 2010). Across comparable products, prices change less often in the euro area than in the US (Gautier and co-authors, 2024). Our 2025–26 menu data show the gap still holds today for restaurant menus. In France, Germany, Spain, Greece and Portugal, 2.3% to 3.5% of menu items change price each month, against 5.0% in the US.
Finding 5. Store shelves move faster than menus.
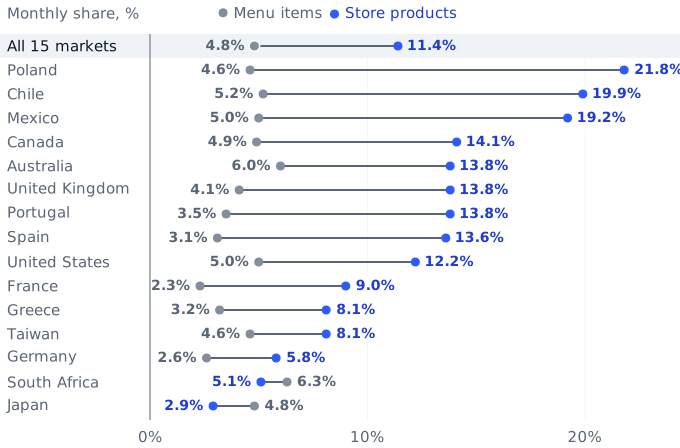
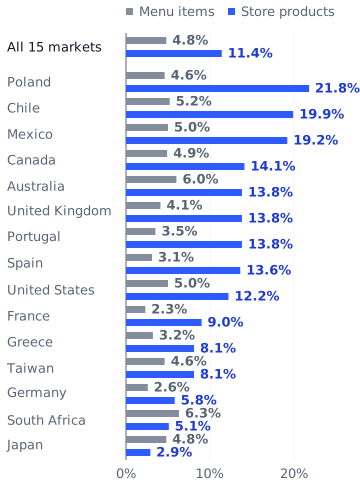
Across all 15 markets, the same method shows that 11.4% of store products change price monthly, from supermarkets to drugstores. That is about 2.4 times the 4.8% for menu items, while store prices also fall more often. Cuts make up 43.2% of store price changes, compared with 17.6% on menus. The median store price change is 10.2%, counting cuts and rises alike. Promotions and temporary sales are included in shelf prices, which may add to the difference between stores and menus.
The gap holds in most of these markets. In the US, 12.2% of store products change price monthly, compared with 5.0% of menu items. Poland has the widest gap: 21.8% of store products change price each month, compared with 4.6% of menu items. Japan and South Africa are the exceptions: there, store prices in our data change less often than menu prices.
Monthly share of items changing price, menus and store shelves, all 15 markets and each market, Sep 2025–Sep 2026.
Source: Realytics · realytics.com · monthly share of menu items and store products changing price, Sep 2025–Sep 2026
What earlier research found. Economists have found a similar split in official US records from 1998 to 2005, comparing processed food with services excluding travel. Processed-food prices changed more frequently and fell more often (Nakamura and Steinsson, 2008). In the euro area in 2024, about 19% of food prices changed monthly, compared with about 8% of service prices. These figures include temporary sales. Food covers shop purchases, while services include restaurant meals (Gautier and co-authors, 2026). These findings can be compared by direction, but their measured sizes depend on different methods, periods and products.
Finding 6. Opinions about prices turn more negative after big price jumps.
This finding needs menu prices and customers' opinions about prices for the same venue, both before and after a rise. Both were available for restaurants and cafés in these markets. Most of these opinions about prices say whether prices feel high or low, and some judge value for money. In a big jump, at least a quarter of a venue's online menu items rose in one month, typically by 8% or more.
Before a big jump, about 33 in every 100 opinions about prices at those venues were negative. In the three months after, about 38 were. At venues in the same country and month with no rise, the share barely changed. So big jumps came with about 3 to 4 more negative opinions in every 100. Counting all opinions together gave about 4, and averaging each venue's change gave about 3. Allowing for chance, the likely range was 2.5 to 5. Matching venues on how negative their opinions were to begin with still left about 2.5. Opinions that judged value for money moved the same way. In 14 of the 15 markets, opinions about prices turned clearly more negative after big jumps.
Smaller steps, with typical rises under 5%, came with less than 1 more negative opinion in every 100. Stricter checks put it at about 2 at most. In the same countries and months, big jumps did worse than small steps in most checks. The gap was about 2 to 4 in every 100, and smaller once starting sentiment was matched.
Change in opinions about prices per 100 in the three months after a rise, compared with venues in the same country and month with no rise. Below zero means more negative.
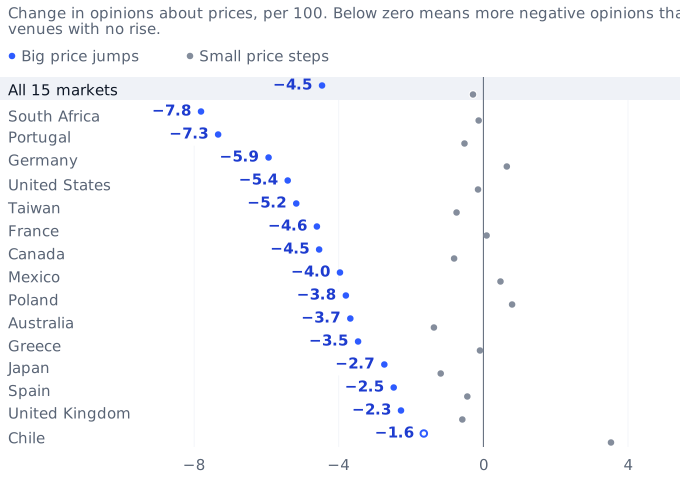
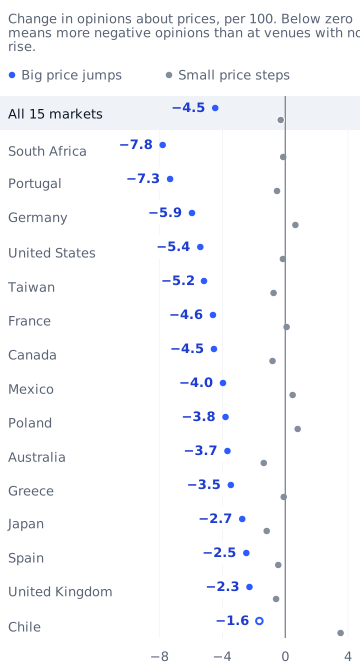
Margin of error at the 95% level: ±0.4 for all 15 markets, ±0.7 for the United States, and up to ±4.5 for smaller markets such as South Africa. Chile, shown hollow, could be zero.
Source: Realytics · realytics.com · menu price rises Sep 2025–May 2026, consumer opinions Jun 2025–Aug 2026
What earlier research found. Kahneman, Knetsch and Thaler (1986) found that people accept a price rise more readily when it covers higher costs. Snir and co-authors (2024) found similar views in US and Israeli surveys, with differences across countries and products. Those surveys asked why prices rose. Our figures follow what customers said after rises of different sizes.
Why it matters, from one business to the whole economy
For one business. When a café, restaurant or store keeps a price for months, that price needs to be right for those months. If it is too low, rising costs cut into each sale until the business changes its price again. If it is too high, it stands out against prices on the same street, so nearby businesses matter too. The best price therefore looks ahead to costs and nearby prices, placing the firm in Woodford's model on one street.
Businesses also look ahead in real life, as a US study of grocery and drug stores from 2001 to 2012 shows. When state minimum wages rose, a 10% rise in the minimum wage lifted grocery prices by about 0.36%. Most of the change came within three months of the law passing, before the higher pay took effect (Renkin, Montialoux and Siegenthaler, 2022). In four California metro areas, restaurant prices began rising faster than elsewhere after the wage law passed in September 2023. The higher pay took effect in April 2024. A new working paper documents this timing (Clemens and co-authors, 2026).
Customers also judge why prices rise: in 1984 and 1985, researchers phoned adults in two Canadian cities and asked about fairness. In one story about a store raising the price of snow shovels the morning after a big snowstorm, 82% called the rise unfair. Another story described a grocer paying its supplier more for lettuce and raising its lettuce price by the same amount. This time, 79% found it acceptable (Kahneman, Knetsch and Thaler, 1986). These answers suggest that people judge both the reason for a price increase and the size of the change.
In 2020, surveys in the US and Israel found the same pattern during the pandemic. People judged rises caused by higher costs fairer than those caused by stronger demand, though views differed by country and product (Snir and co-authors, 2024). In 2024, another large US burger chain faced a backlash over plans for prices that change through the day. After the outcry, it said the changes would bring discounts at quieter times, not higher prices at busy ones.
For households. Every price a household pays reflects a business deciding when to change it and by how much. When businesses face higher costs, their prices may follow next month or a year later, which decides when families feel the rise. This timing also affects when rising costs can ease. For hand-to-mouth households, higher prices quickly reduce what the next pay cheque buys.
Families also judge inflation through familiar prices, according to research combining grocery-shopping records from more than 90,000 US households with surveys about expected inflation. The four economists found that often-bought items mattered more than items taking a large share of the budget. Price increases also carried more weight in people's minds than price cuts (D'Acunto, Malmendier, Ospina and Weber, 2021). A weekly coffee provides another familiar price, although this study examined groceries rather than café purchases.
For the whole economy. The timing and size of price changes help shape how costs and interest rates affect inflation across the economy. Central banks use models of these links when setting rates, while measured price changes in different places connect the models to real life.
Why firms set prices on guesses
Economists call the time and money needed to gather facts an "information friction".
Technology has changed the work of updating shelf prices. Electronic shelf labels are small screens that display prices. A grocery chain adopted them in 2015, making more frequent price changes in smaller steps. The extra changes were mostly cuts (Stamatopoulos, Bassamboo and Moreno, 2021). Before such labels, in the early 1990s, each shelf-price change cost about 52 US cents at four supermarket chains (Levy and co-authors, 1997).
Another study examined a large US manufacturer, comparing physical repricing costs with the costs of managers' work and customer discussions. Physical costs included printing and distributing price lists, while managers' work cost more than six times as much. Customer discussions and negotiations cost more than twenty times as much (Zbaracki and co-authors, 2004). For a café, deciding on a new price may take more work than printing it.
In a 2009 paper, Woodford modelled firms spending time and attention to learn about market conditions before deciding whether to reprice. In the model, limited information makes prices adjust more slowly, with timing that often resembles the standard model's repricing lottery. However, large shocks, such as sudden jumps in costs, can make firms in the model reprice sooner.
A New Zealand study began surveying firms in 2013, asking managers about recent inflation and their forecasts. Inflation at the first survey was about 1.5%, but only about half of firms guessed it to within 2 points. About 6 in 10 firms said they did not track inflation at all.
Researchers gave some firms information about the central bank's target or recent inflation, and the firms moved their forecasts toward those facts. These two types of information led to larger forecast changes than information about the forecasts of experts or other firms.
The study also tracked decisions about prices, jobs, equipment spending and wages to examine how firms responded to information. In a later experiment, firms that overestimated the target lowered their forecasts when they learned what it was. Compared with firms given no facts, they hired and invested less than planned. Prices and wages showed no clear change (Coibion, Gorodnichenko and Kumar, 2018).
In Italy, a regular survey gave the latest inflation figures to randomly chosen firms, while other firms were not told (Coibion, Gorodnichenko and Ropele, 2020). Firms whose inflation expectations rose increased their prices and wanted to borrow more, while reducing jobs and capital, such as equipment. When central-bank interest rates were near their lower limit, however, the study found no fall in jobs.
Firms pay less attention to inflation mainly when it is low. US surveys that began in 2018, when inflation was low, found large gaps in managers' inflation knowledge (Candia, Coibion and Gorodnichenko, 2024). As inflation rose, firms and households became better informed, so new facts moved their forecasts less (Weber and co-authors, 2025).
What this means. Many firms base their prices on guesses that can be far off, especially when inflation is low and draws little attention. These studies show that new information can change both the forecasts firms make and the decisions they take.
For one café, restaurant or store
Before changing a price, an owner can Ask Realytics about nearby businesses. Which businesses changed their prices this year, and by how much, on menus or on store shelves? How do customers feel about value for money at each one and at the owner's own business? The answers cover the businesses around one address.
For chains, franchise systems and brands
Stefano DellaVigna and Matthew Gentzkow, two economists, studied large US chains of food stores, drugstores and big discount stores (2019). Most charged nearly the same prices everywhere, even where local markets were very different. Against their model of local pricing, the typical chain's estimated profit gap was about $16 million a year. Restaurant and store chains face the same choice across their locations.
A study of US retail chains from 2006 to 2018 adds a distinction (Butters, Sacks and Seo, 2022). Chains often keep the same price despite differences in local demand, but pass local cost differences into prices. When local taxes rose, prices increased only at the affected stores.
Realytics gives a pricing team the local picture for every location at once, so it can compare the markets surrounding its businesses. Teams can compare how quickly nearby menu and shelf prices are moving, alongside customer sentiment of value for money at each location. This shows where one price card fits its markets and where it does not. Franchisees, who run a chain's locations under its name, and head office can bring the same local evidence to a price discussion.
For economists and central banks
Earlier restaurant-price studies used government records, till data from about a thousand restaurants, or online menus numbering a few hundred. One study of a minimum-wage rise in and around San Jose used 884 online menus (Allegretto and Reich, 2018). Realytics follows menus every week, measured the same way everywhere. Its Menu Price Index tracks the same dish at the same venue over time and is available in the product.
The data can be divided by city, restaurant or store type, and chain or independent, allowing researchers to examine different groups. Realytics also records venue openings and closures, alongside customers' sentiment of value for money, which researchers can use to explore new questions. How fast does a minimum-wage, tax or currency change reach menu prices in each country? When food prices rise on store shelves, do nearby menu prices also rise, and how much later? Do country differences follow inflation, wages and taxes, and do the venues that reprice least close more often?
Realytics welcomes research with economists, universities and central banks on these questions. Researchers can write to hello@realytics.com.
About Realytics
Realytics helps businesses worldwide get measurable results from the market around them. Realytics has built the AI business partner for local brands, and for the companies that work with local businesses.
For two decades, the online world pulled ahead of local shops on one thing: data. It learned from every click what people wanted and what to do next. Realytics brings the same kind of evidence to shops, cafés and restaurants operating on real streets around the world.
- For one location: evidence covers what people say about the business, prices on its street, and the move to make next.
- For operators: every location is judged against its own street, every week.
- For chains, franchisors, brands, landlords, investors and public bodies: hundreds of markets are measured in the same way.
- For agencies and platforms that serve local businesses: the same data is available inside their own products.
Realytics links records across 288 million locations and more than 800,000 chains, with data refreshed every week since 2020. The team has worked at major data companies. More about Realytics.